Free soil temperature readings
Current Soil Temps by ZIP Code
Enter a ZIP code above to look up the current soil temperature at your location, plus planting windows and lawn care recommendations from the nearest USDA monitoring station.
Advanced options (year, as-of date)
Know when to seed, fertilize, and stop crabgrass at your address, timed by live local soil temperature instead of the calendar.
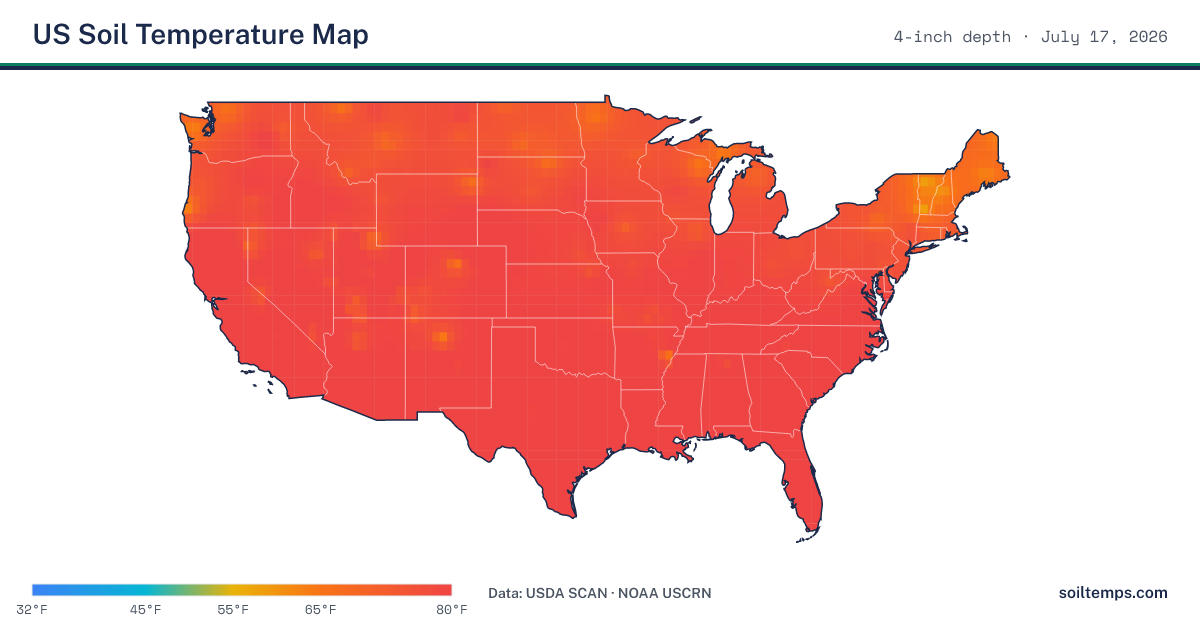
Check the current soil temp at your location, or open the live US soil temperature mapto see today’s ground readings from 380+ USDA and NOAA stations across the country. Enter your city or ZIP code for live soil temperatures near you, plus planting windows, pre-emergent timing, fertilizer guidance, and disease watch alerts for your area.
More Soil & Lawn Tools
Soil Moisture Map
Compare current in-ground soil moisture with each station's seasonal history across the United States.
Lawn-Care Schedule
Get a city-specific lawn-care schedule timed to current soil temperature, weather, and seasonal thresholds.
4-Inch Soil Temperature
Browse current 4-inch root-zone soil temperatures by state and city for lawn and garden timing.
Soil Temperature by Depth
Compare current and average soil temperature at 2, 4, 8, 20, and 40 inches from federal monitoring stations.
Growing Degree Days
Track growing degree days by state and city to time lawn growth, weeds, pests, and seasonal work.
How Soil Temperature Drives Lawn Timing
Track how soil temperatures are trending at your location with daily readings and 12-month historical data. Unlike air temperature forecasts, soil temps change gradually. A sustained warming trend over several days is a stronger planting signal than any single reading. Enter your city or ZIP code above to see the current soil temperature trend for your area.
Soil temperatures, sometimes called ground temperatures, ground temps, or simply soil temps, shift more slowly than air readings, making them a more reliable indicator of root zone conditions. When the 2-inch depth reaches germination thresholds for several consecutive days, weed seeds activate. That is your signal for pre-emergent timing. At 4-inch depth, sustained temperatures above 65°F indicate warm-season grass is actively growing and ready for fertilizer or aeration. Compare the planting window and recommendation guidance above with the daily chart below to make your decision.
About the Data
Readings refresh nightly from the USDA-NRCS Soil Climate Analysis Network and the NOAA US Climate Reference Network (USCRN). Readings come from in-ground sensors at federal monitoring stations when current suitable readings are available, and from modeled estimates otherwise; see how we measure. Planting windows are derived from multi-year climatology, overlaid with NOAA 1991–2020 frost normals where a station is close enough to support a local frost date. Recommendation cards evaluate current soil conditions against research-backed thresholds from university extension sources. Check back regularly as conditions change. The guidance updates with every new reading.
Data sources: USDA-NRCS SCAN network, NOAA USCRN, NOAA 1991–2020 climate normals, and localized frost climatology via Soil Temps analytics.
Browse soil temperature data by state, over 2,000 cities with current readings, hardiness zones, and planting windows.
Current soil temperature by state: Ohio, Michigan, Iowa, Kansas, Illinois, Wisconsin, Minnesota, Pennsylvania, New York, Nebraska, and all 50 states.
Explore the US Soil Temperature Map for a live station view of readings across the country.
Ground Temperature vs Soil Temperature
Ground temperature and soil temperature mean the same thing here, and both are used interchangeably on this site. People also shorten them to ground temp or soil temp. Each refers to the temperature a few inches below the surface, not the air above it, which is why the ground can stay cold for weeks after a warm spell. Enter your city or ZIP code above for the current ground temperature near you, or open the live map to see ground temps at 2, 4, and 8-inch depths across the country.
Average Soil Temperature by Month
Average soil temperature is the long-term normal for a date, not today’s reading, and it varies far more by location than by year. The table shows typical 2-inch soil temperatures by month for four cities across the climate bands, from multi-year averages at each city’s nearest USDA or NOAA monitoring station. Enter your ZIP code above to see today’s reading beside the long-term average for your own location, and every city page links its month-by-month history. For the same averages at every measured depth, see the soil temperature by depth chart.
| Month | Minneapolis, MN | Columbus, OH | Nashville, TN | Dallas, TX |
|---|---|---|---|---|
| January | 30°F | 34°F | 43°F | 46°F |
| February | 30°F | 35°F | 46°F | 49°F |
| March | 32°F | 44°F | 55°F | 58°F |
| April | 38°F | 52°F | 60°F | 65°F |
| May | 52°F | 60°F | 66°F | 73°F |
| June | 64°F | 70°F | 71°F | 82°F |
| July | 68°F | 75°F | 75°F | 85°F |
| August | 67°F | 72°F | 74°F | 85°F |
| September | 62°F | 67°F | 70°F | 78°F |
| October | 52°F | 59°F | 62°F | 69°F |
| November | 40°F | 45°F | 54°F | 58°F |
| December | 33°F | 40°F | 48°F | 52°F |
Shaded spring cells fall in the 50°F to 55°F pre-emergent window at 2-inch depth. The highlighted row is the current month.
Soil Temperature FAQ
What soil temperature is needed to plant grass seed?
Cool-season grasses like fescue and bluegrass germinate best when soil at 2 inches stays between 50–65°F for several consecutive days. Warm-season grasses like Bermuda and Zoysia need soil temperatures of 65°F or higher before seeding.
How deep should I measure soil temperature?
Use 2 inches for germination decisions, since that is where seeds sit. Use the 4 inch soil temperature for established lawn and garden timing: it reads the root zone, changes more slowly than the surface, and is the depth most fertilizer, aeration, and disease guidance references. The 8 inch reading shows deeper root-zone trend. The 20 and 40 inch readings track deep soil and frost depth where federal stations report them.
What does the 4 inch soil temperature mean?
The 4 inch soil temperature shows conditions deeper in the root zone than the 2 inch germination reading. It is commonly used for established lawn, garden, and agricultural timing because it changes more slowly than the surface layer, so it is a steadier signal for fertilizer, aeration, and weed-control decisions.
What’s the difference between soil temperature and air temperature?
Soil changes temperature much more slowly than air due to thermal mass. A warm afternoon does not mean the ground is warm. Soil temperature lags air temperature by days or weeks, making it a more reliable indicator of when biological processes like germination actually begin.
When should I apply pre-emergent based on soil temperature?
Apply pre-emergent herbicide when soil at 2 inches reaches 55°F for several consecutive days. This is the threshold where crabgrass and other summer annual weeds begin germinating. Applying after this point reduces effectiveness significantly.
How hot is the ground right now?
Enter your ZIP code above for the current ground temperature, often shortened to ground temp, at your location, measured at 2 and 4 inches by the nearest USDA or NOAA monitoring station and updated daily. The ground warms and cools more slowly than air: in spring it usually runs cooler than the afternoon air, and in fall it holds warmth after nights turn cold.
What is the average soil temperature by month?
Monthly soil temperature normals depend on location. In the northern US, 2-inch soil averages near 30°F in January and reaches the upper 60s°F in July, while across the South it stays in the 40s°F or warmer all winter and peaks in the mid 80s°F in summer. Enter your ZIP code above to compare today's reading against the long-term average for this date at your location.
What is the soil temperature in my area right now?
Enter your ZIP code above, or tap Use my location, and the site shows the current soil temperature in your area from the nearest of 380+ USDA and NOAA monitoring stations, measured at 2 and 4 inch depths and updated daily. Where a current suitable station reading is unavailable, the reading is a modeled estimate for your coordinates instead.
What is a USDA Plant Hardiness Zone?
USDA Plant Hardiness Zones divide the US into 13 zones based on average annual extreme minimum temperature. They help determine which plants and grasses can survive winter in your area. Zone numbers increase from coldest (1a) to warmest (13b).
What is the ground temperature by ZIP code right now?
Ground temperature is another way people refer to soil temperature. Enter your ZIP code to see the current soil temperature near you, using nearby USDA SCAN and NOAA USCRN in-ground sensor readings where available, with modeled fallback where a federal station is not close enough.